【Note】Vega:一种用于生成可视化图表的声明式语言,支持Web/Server/CLI
"Vega 是一种用于生成可视化图表的声明式语言,它的特点在于配套工具链比较完善,支持Web/Server/CLI等多种环境。"
Website: Vega
Vega 是一种用于生成可视化图表的声明式语言,它基于JSON定义,只要你根据特定的JSON格式进行描述,并且使用它的工具链,便能生成相应的可视化图表。
例如:
{ "$schema": "https://vega.github.io/schema/vega/v5.json", "width": 400, "height": 200, "padding": 5,
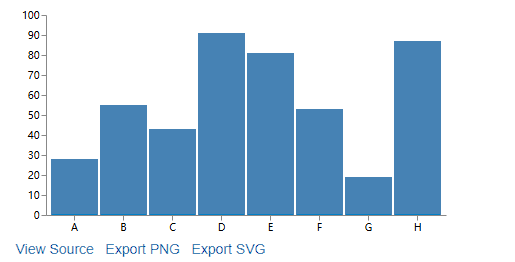
"data": [ { "name": "table", "values": [ {"category": "A", "amount": 28}, {"category": "B", "amount": 55}, {"category": "C", "amount": 43}, {"category": "D", "amount": 91}, {"category": "E", "amount": 81}, {"category": "F", "amount": 53}, {"category": "G", "amount": 19}, {"category": "H", "amount": 87} ] } ],
"signals": [ { "name": "tooltip", "value": {}, "on": [ {"events": "rect:mouseover", "update": "datum"}, {"events": "rect:mouseout", "update": "{}"} ] } ],
"scales": [ { "name": "xscale", "type": "band", "domain": {"data": "table", "field": "category"}, "range": "width", "padding": 0.05, "round": true }, { "name": "yscale", "domain": {"data": "table", "field": "amount"}, "nice": true, "range": "height" } ],
"axes": [ { "orient": "bottom", "scale": "xscale" }, { "orient": "left", "scale": "yscale" } ],
"marks": [ { "type": "rect", "from": {"data":"table"}, "encode": { "enter": { "x": {"scale": "xscale", "field": "category"}, "width": {"scale": "xscale", "band": 1}, "y": {"scale": "yscale", "field": "amount"}, "y2": {"scale": "yscale", "value": 0} }, "update": { "fill": {"value": "steelblue"} }, "hover": { "fill": {"value": "red"} } } }, { "type": "text", "encode": { "enter": { "align": {"value": "center"}, "baseline": {"value": "bottom"}, "fill": {"value": "#333"} }, "update": { "x": {"scale": "xscale", "signal": "tooltip.category", "band": 0.5}, "y": {"scale": "yscale", "signal": "tooltip.amount", "offset": -2}, "text": {"signal": "tooltip.amount"}, "fillOpacity": [ {"test": "isNaN(tooltip.amount)", "value": 0}, {"value": 1} ] } } } ]}会生成一张这样的柱状图:
令我比较喜欢的是它的工具链支持在命令行与服务器端使用,可以考虑把图像生成直接放在后端:
// 官网的例子var vega = require('vega');
// create a new view instance for a given Vega JSON specvar view = new vega.View(vega.parse(spec), {renderer: 'none'});
// generate a static SVG imageview.toSVG()  .then(function(svg) {    // process svg string  })  .catch(function(err) { console.error(err); });
// generate a static PNG imageview.toCanvas()  .then(function(canvas) {    // process node-canvas instance    // for example, generate a PNG stream to write    var stream = canvas.createPNGStream();  })  .catch(function(err) { console.error(err); });
【END】